Data Scientist & ML Engineer · March 2024–February 2025
Decathlon
Exploring how holidays, weather and events can improve sales forecasts through covariate research and feature engineering.
- My role
- Data Scientist & ML Engineer
- Location
- Croix / Lille, France
- Employment period
- March 2024–February 2025
- Forecast model
- Temporal Fusion Transformer
My work at Decathlon
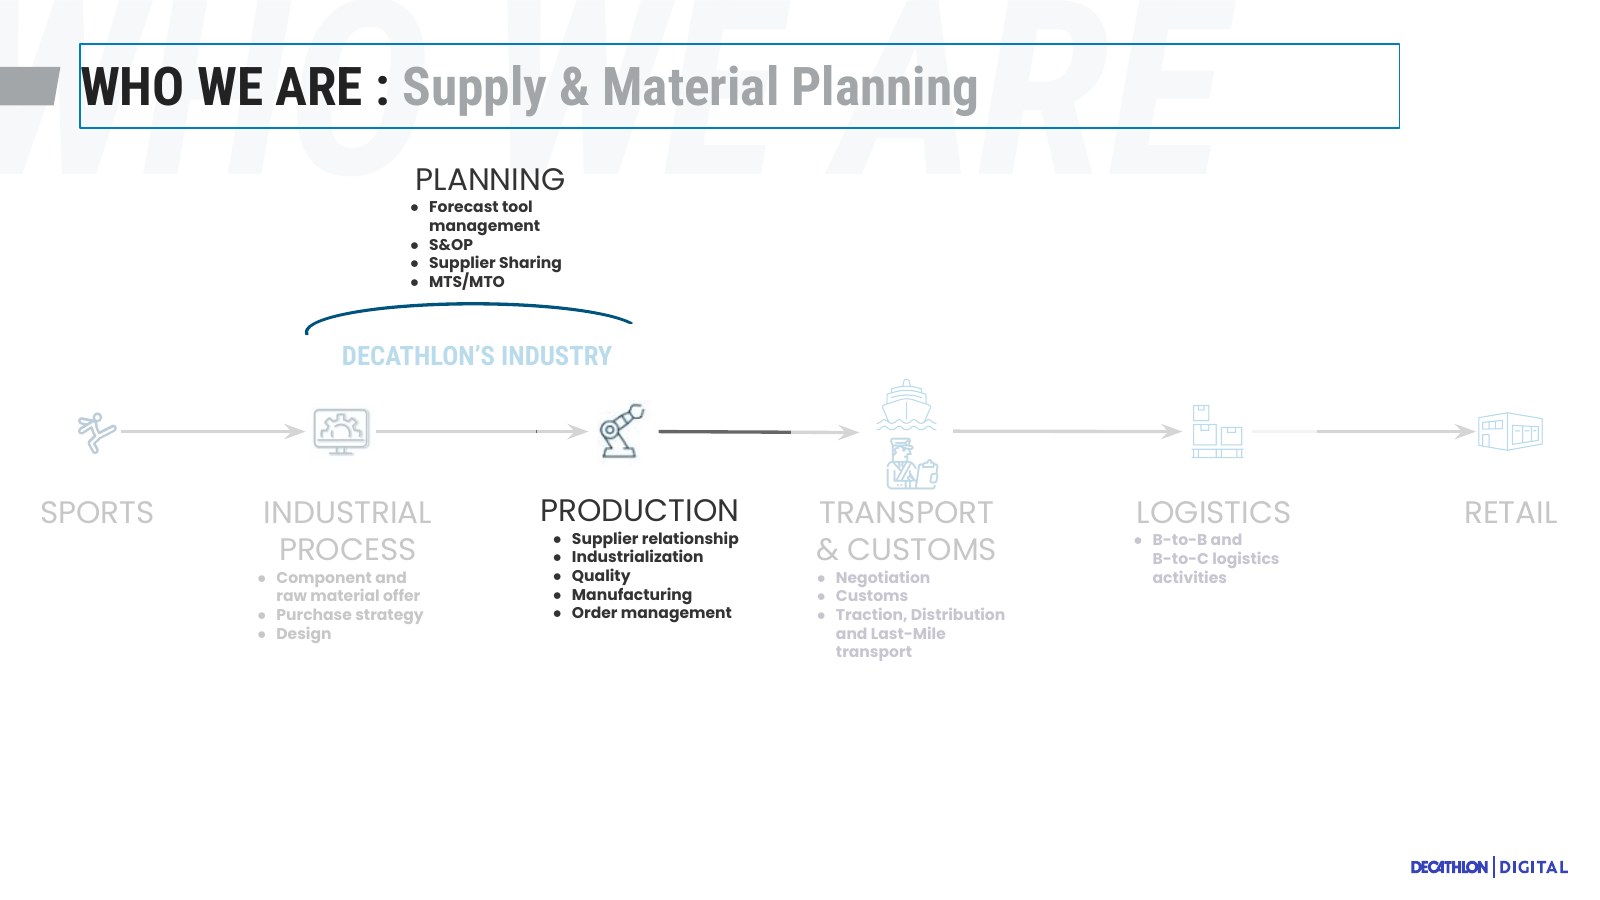
At Decathlon Digital, I worked mainly on forecasting covariates: additional inputs such as public holidays, school vacations, weather and events that might help explain changes in demand. My work involved preparing external data, engineering features and evaluating whether those signals added useful information to sales forecasts.
I started with an internship from March to September 2024, then continued working at Decathlon until February 2025.
The example below comes from my internship report and focuses on calendar variables in an existing Temporal Fusion Transformer forecasting model. The detailed scope of my subsequent work is confidential. The wider forecasting platform was a team effort.
Build a calendar dataset the model can use
Before training anything, I had to find calendar sources with enough history, future coverage, regional detail and a dependable update process. I compared government data, Date Holidays, Workalendar and Open Holiday API with input from data stewards.
I aligned the selected calendar information with weekly sales data, including the date, holiday name and its position in the week. School-vacation coverage varied across sources, so I began that part of the analysis with France and its three school zones. Preparing comparable data was a substantial part of the work.
From external dates to forecasting features
- Source — Check date coverage, regional detail, reliability and maintenance.
- Align — Connect calendar dates to the weekly sales index and relevant geography.
- Encode — Represent holiday timing and vacation periods as model inputs.
Check the analysis before extending the model
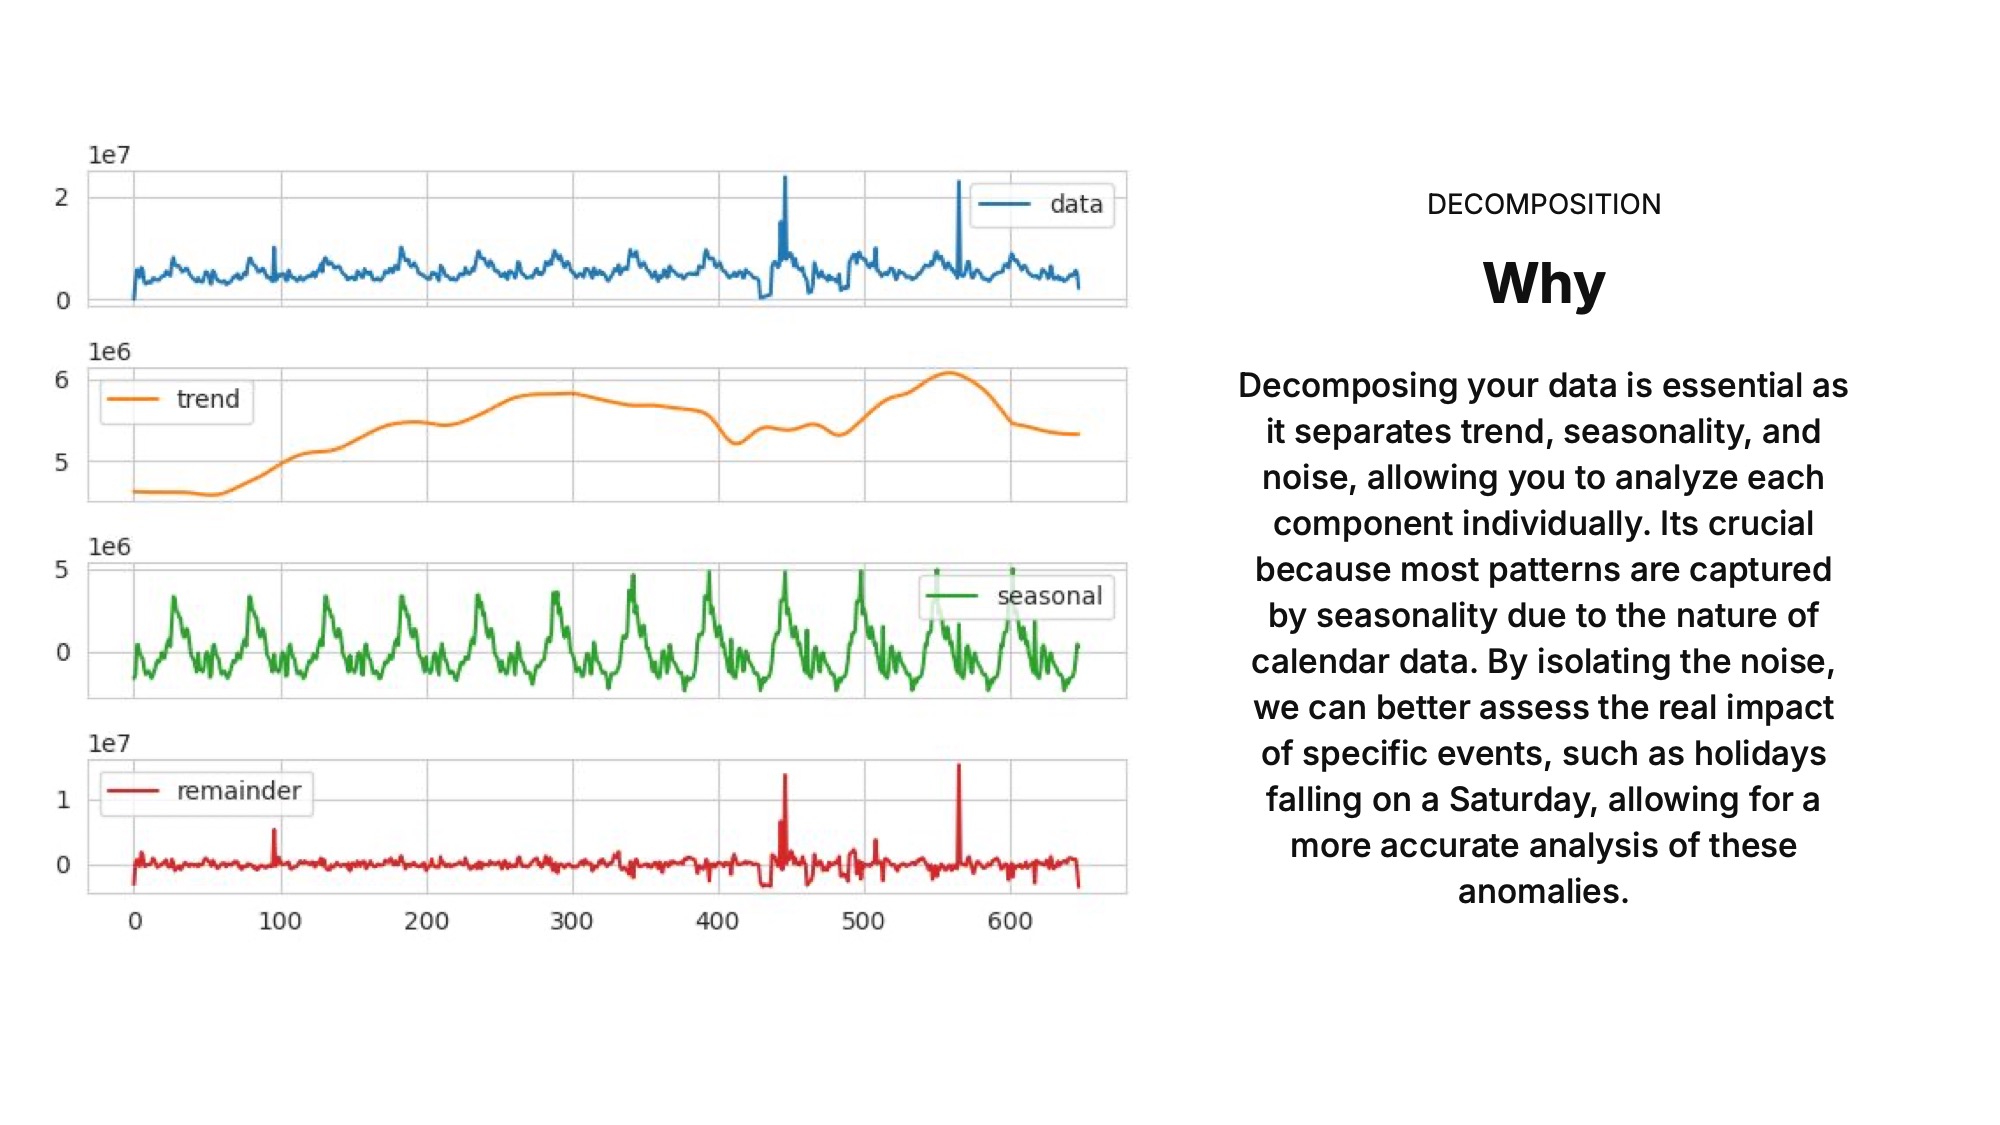
A recurring event can already be partly represented by seasonality. I decomposed the sales series into trend, seasonal and residual components to investigate what additional signal calendar features might offer.
I also had to revisit early findings. An apparent lag before a holiday disappeared after correcting the implementation. I reran the analysis and compared less seasonal products as well as aggregate sales. That correction mattered: an appealing explanation of buying behaviour was not enough to make a feature useful.
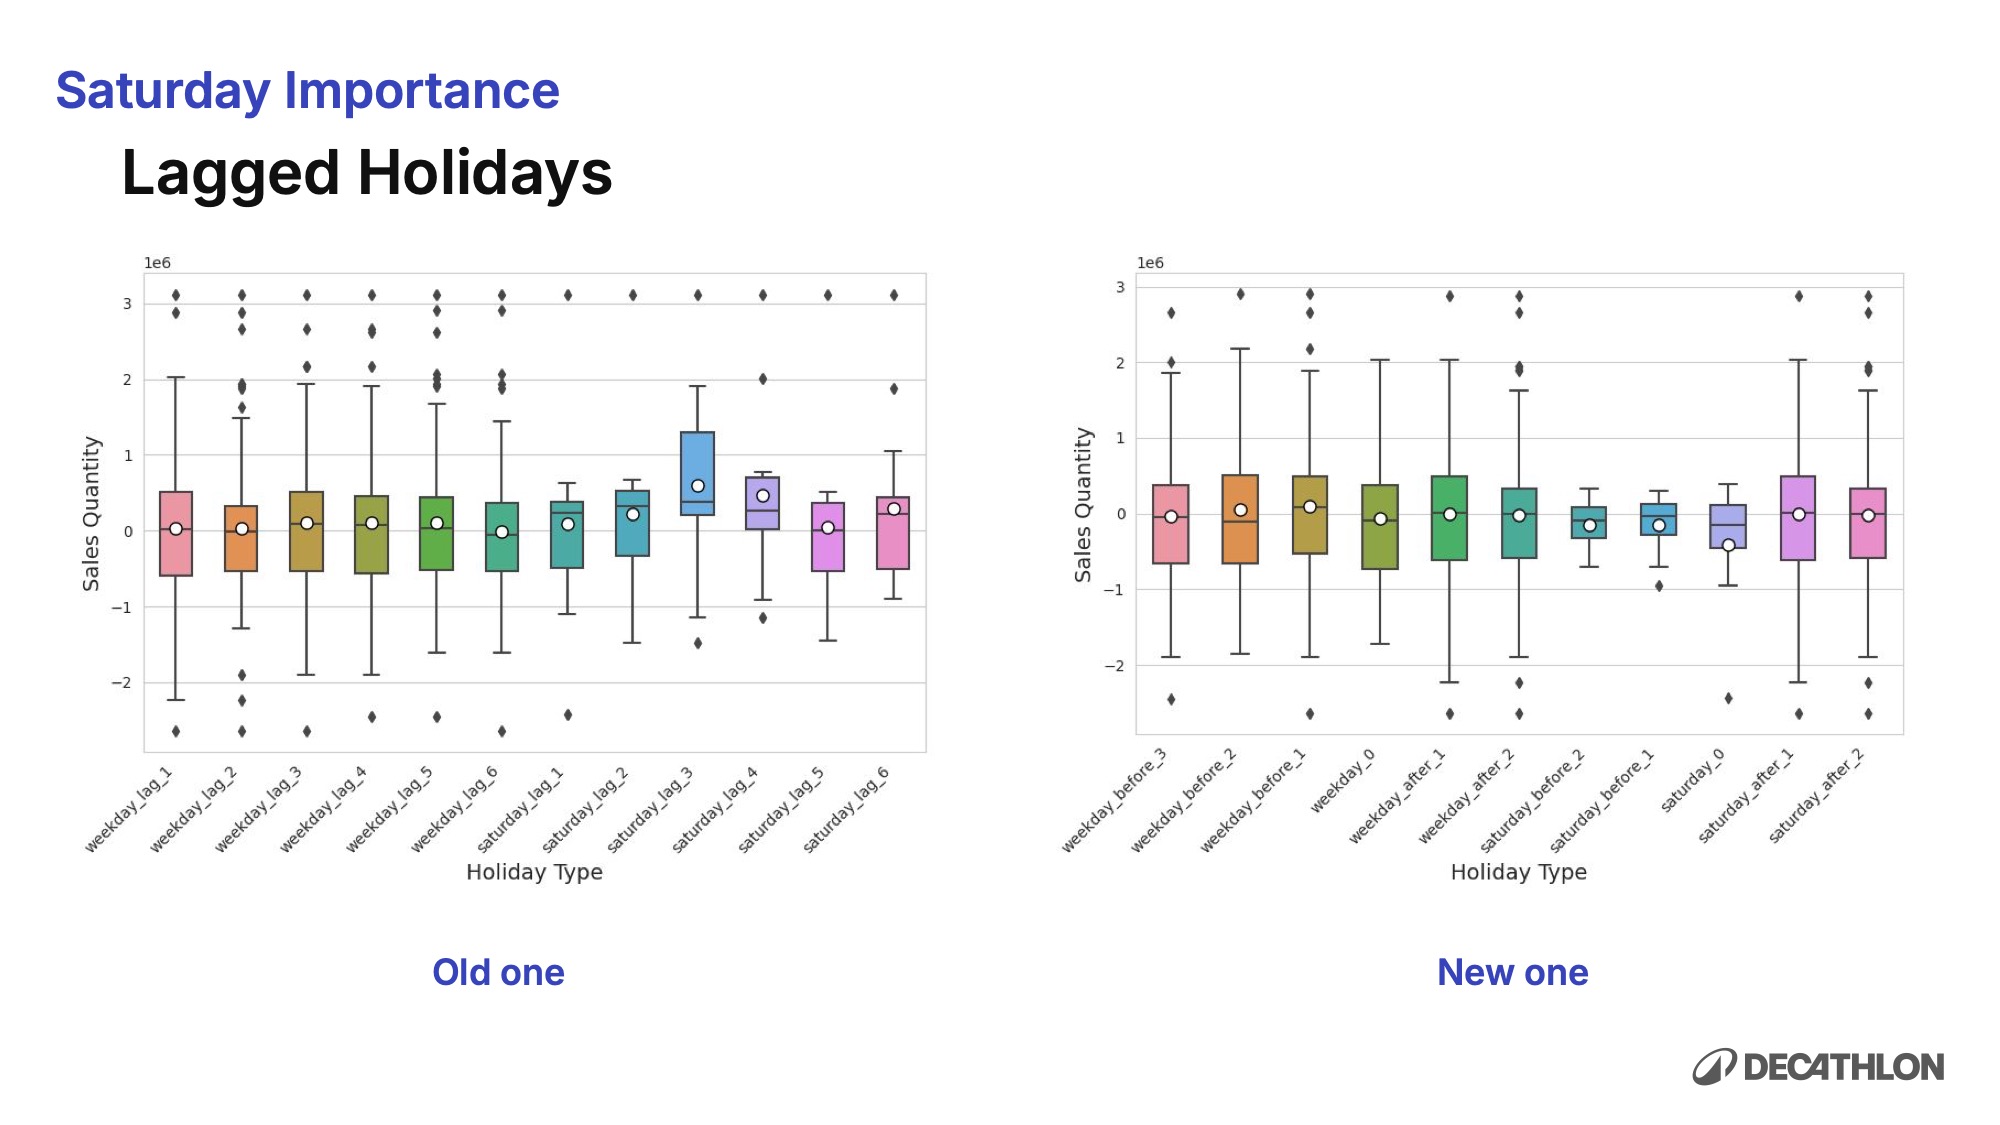
Turn dates into features
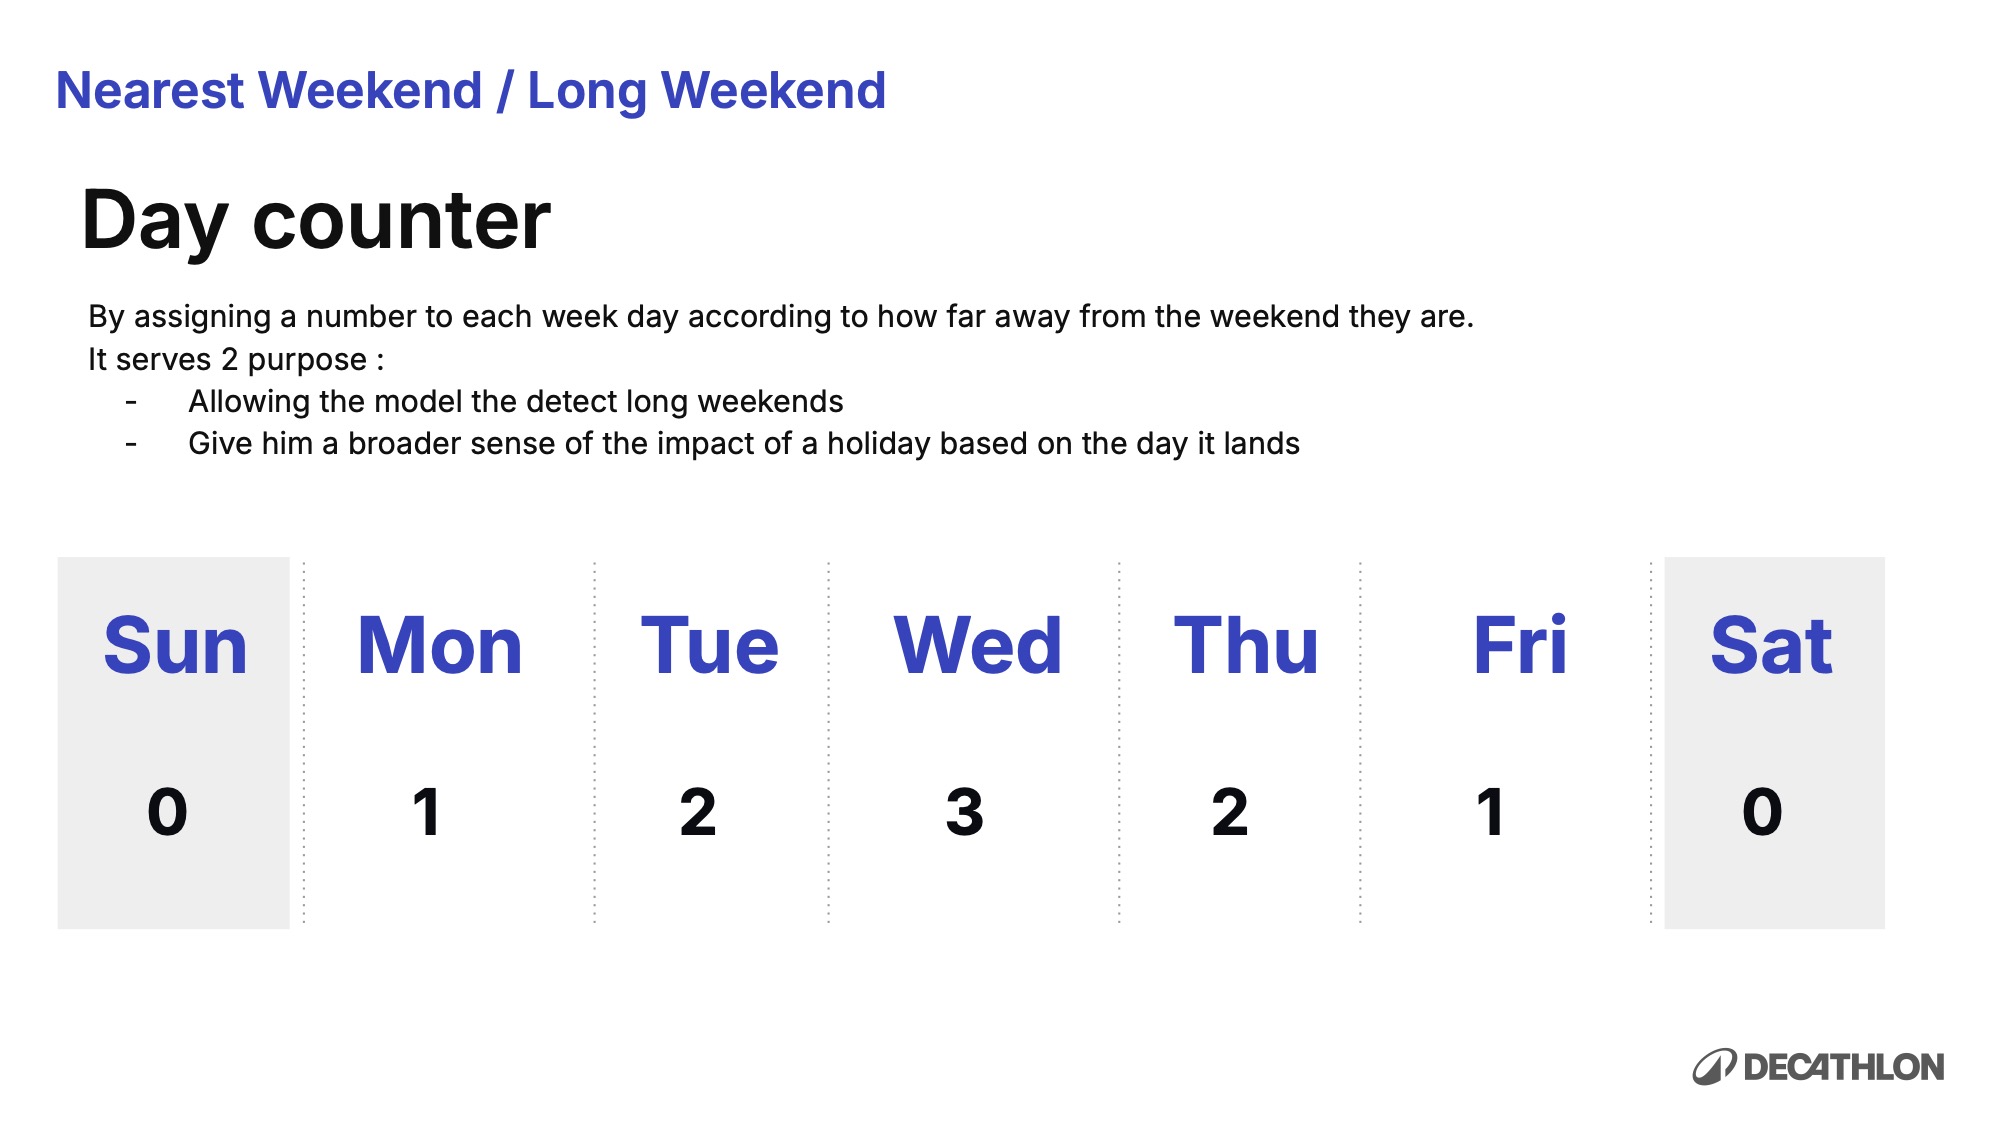
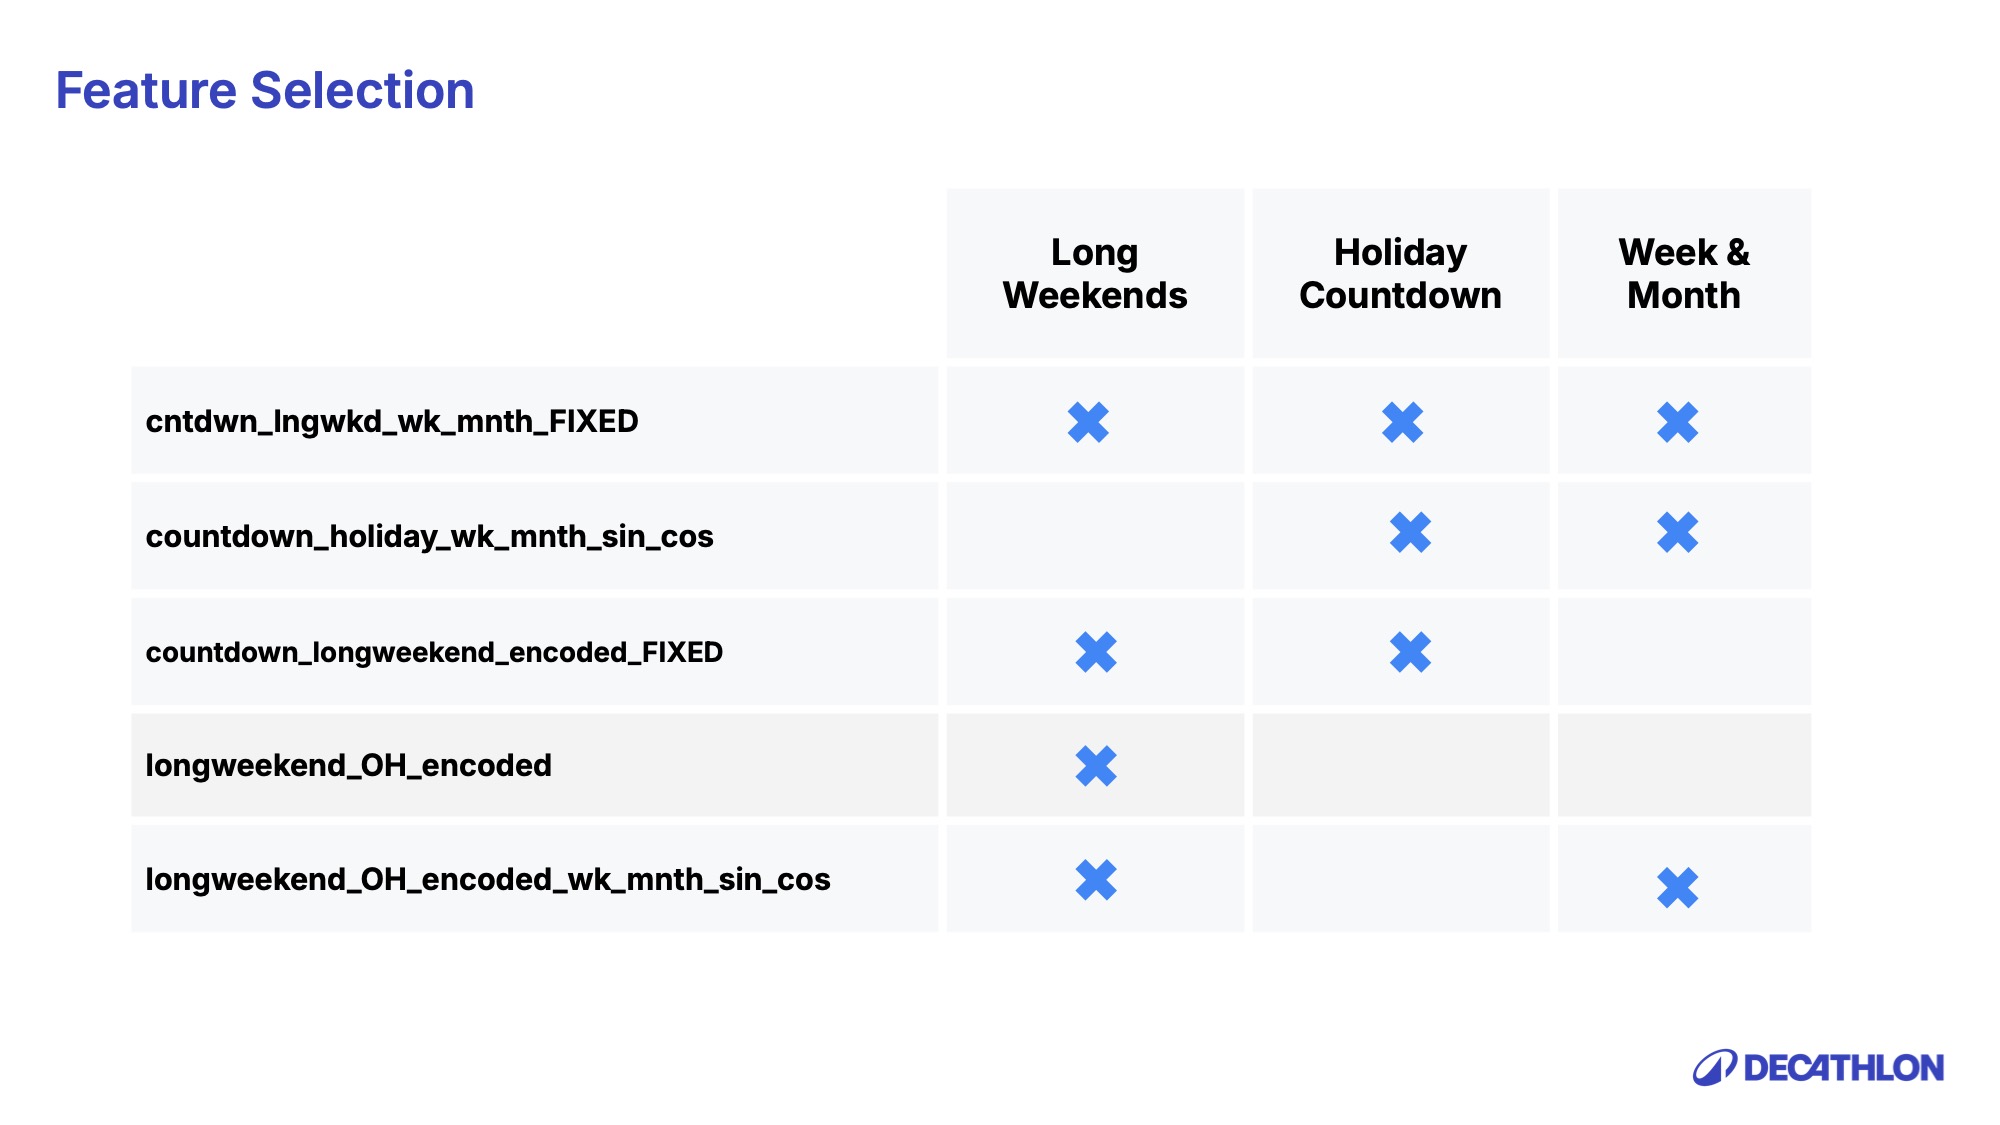
I explored holiday flags, long weekends and a countdown to the next holiday. A Day Counter represented how close the holiday’s weekday was to the weekend, using values from 0 to 3. The experiments also considered week/month representations and French school vacations.
The representation itself became an experiment. After team feedback, I compared scalar and one-hot encodings, applied MinMax scaling to the holiday countdown and tested sine/cosine representations of week and month. Different encodings gave the model different ways to use the same calendar information.
Backtest the idea, then look inside the score
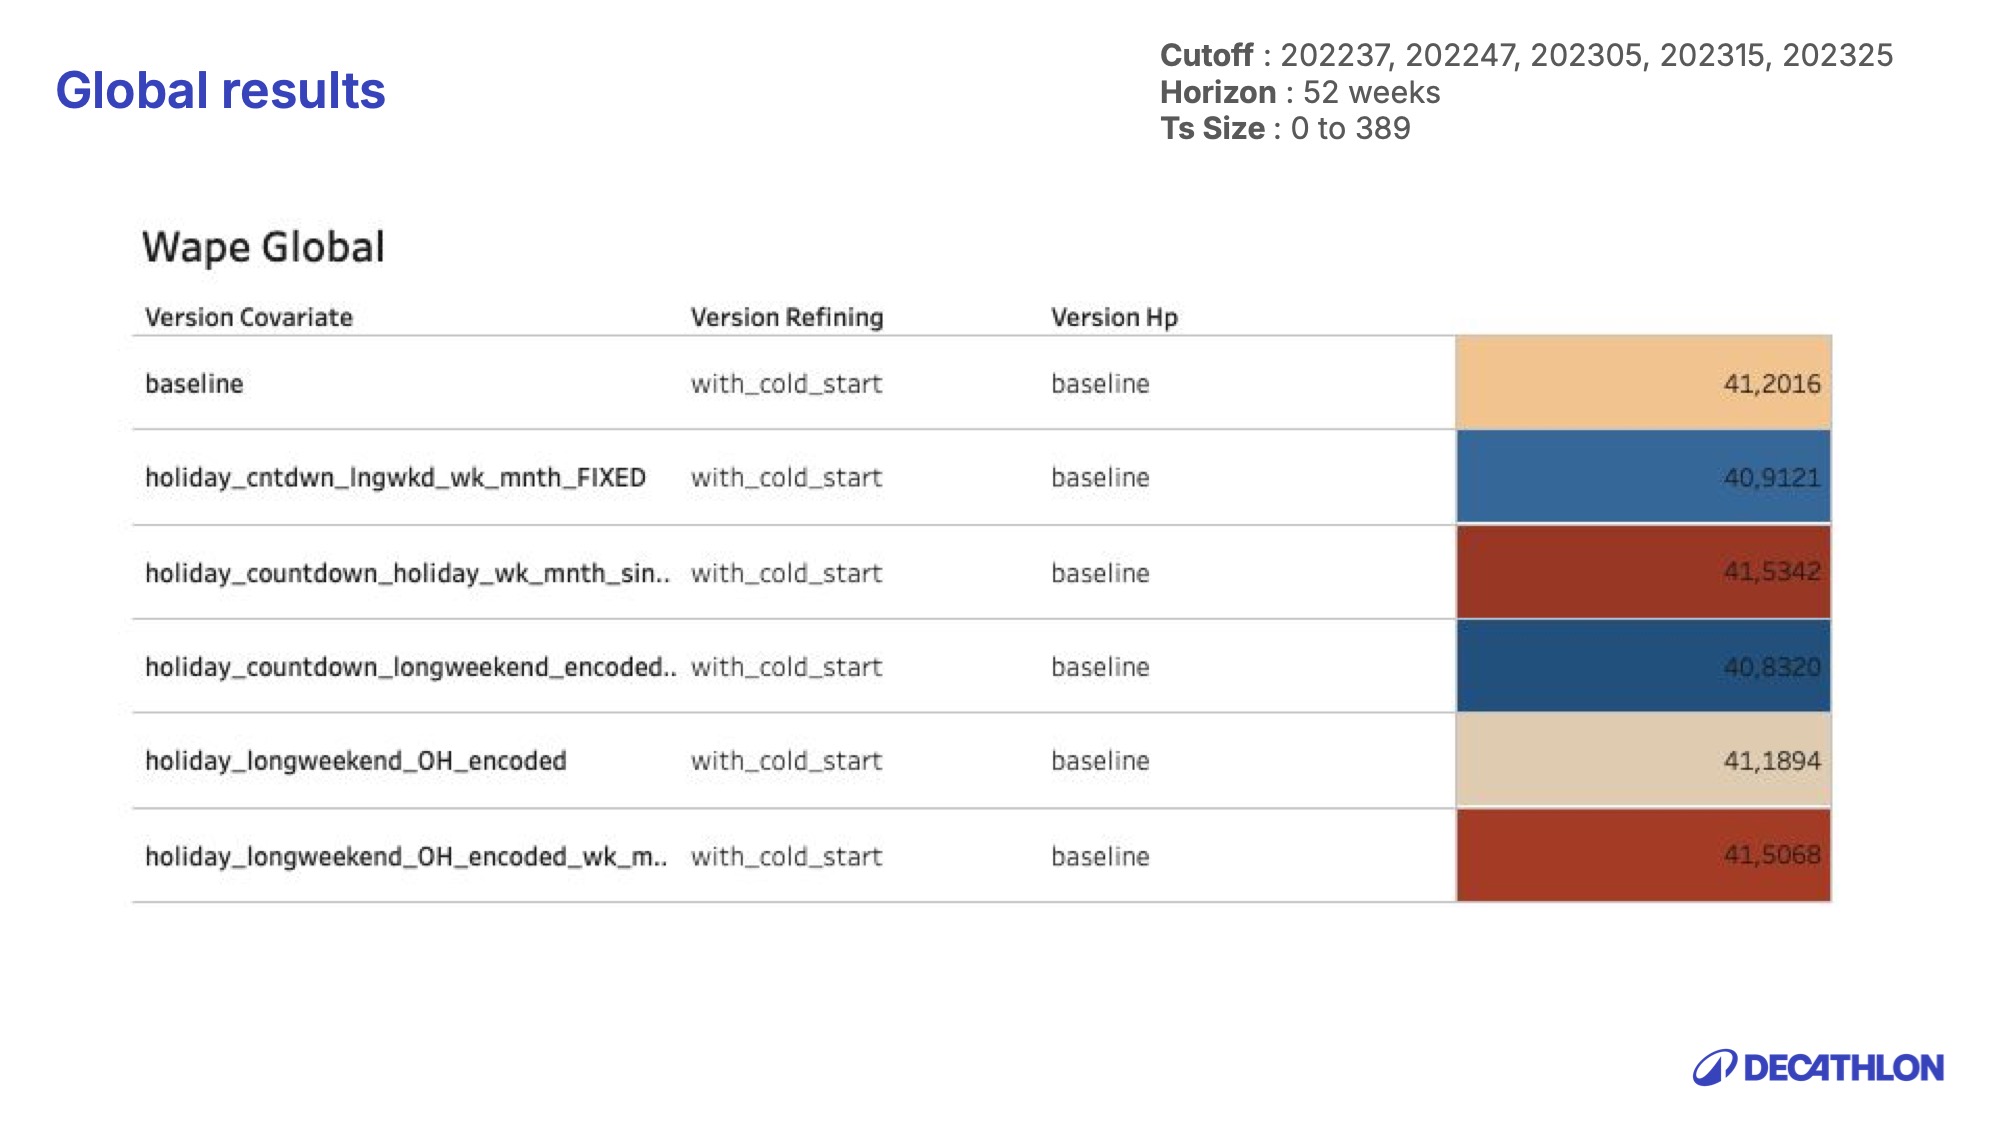
I compared model variants with the existing production-model baseline in offline tests. The report describes a 52-week forecast horizon and five cutoffs: weeks 37 and 47 of 2022, and weeks 5, 15 and 25 of 2023. Using several cutoffs made it possible to inspect performance across different parts of the year.
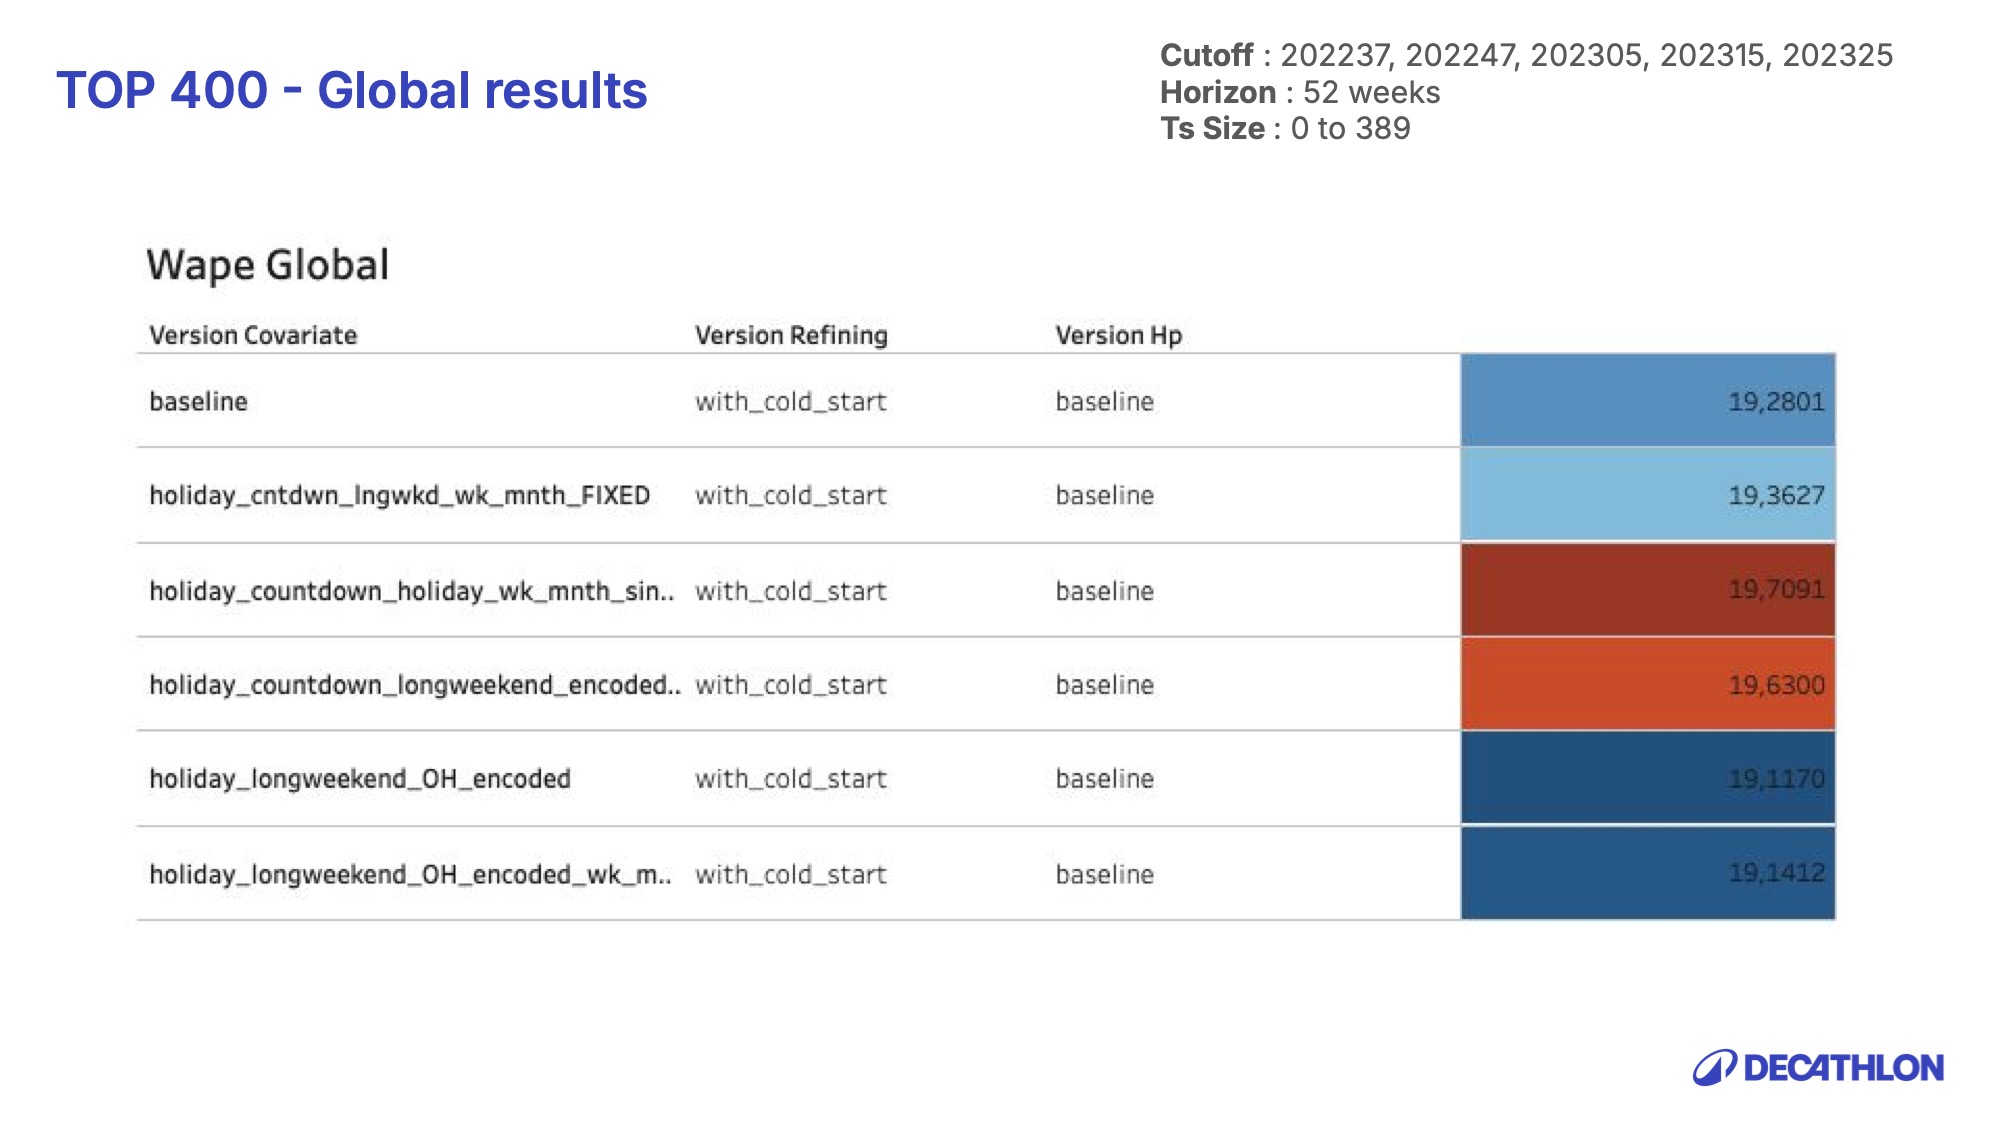
The first aggregate comparison did not improve on the baseline, while a Top 400 product analysis was more promising. I then refined the encodings and ran another benchmark. The report records training runs of roughly three to four hours, so choosing and documenting each experiment was important.
How the forecasting variants were evaluated
- Compare — Use the same reported reference model and evaluation horizon.
- Break down — Inspect cutoffs, product groups and the Top 400 product subset.
- Revise — Use the findings and team feedback to choose the next feature encoding.
A modest gain, and a change in ranking
The revised global benchmark reported a baseline WAPE of 41.20 and two variants at 40.91 and 40.83. Lower WAPE means lower forecast error in this evaluation. The best displayed global result was approximately 0.37 lower on the reported WAPE scale.
The result did not carry over uniformly. The best global variant was not the best on the Top 400 subset, where a different encoding performed better. That was the useful conclusion: a feature needs to be evaluated with the products and periods it is intended to serve.
- Baseline WAPE
- 41.20
- Best reported global WAPE
- 40.83
- Lower on the WAPE scale
- 0.37
- Forecast horizon
- 52 weeks
Use interpretation to decide what to test next
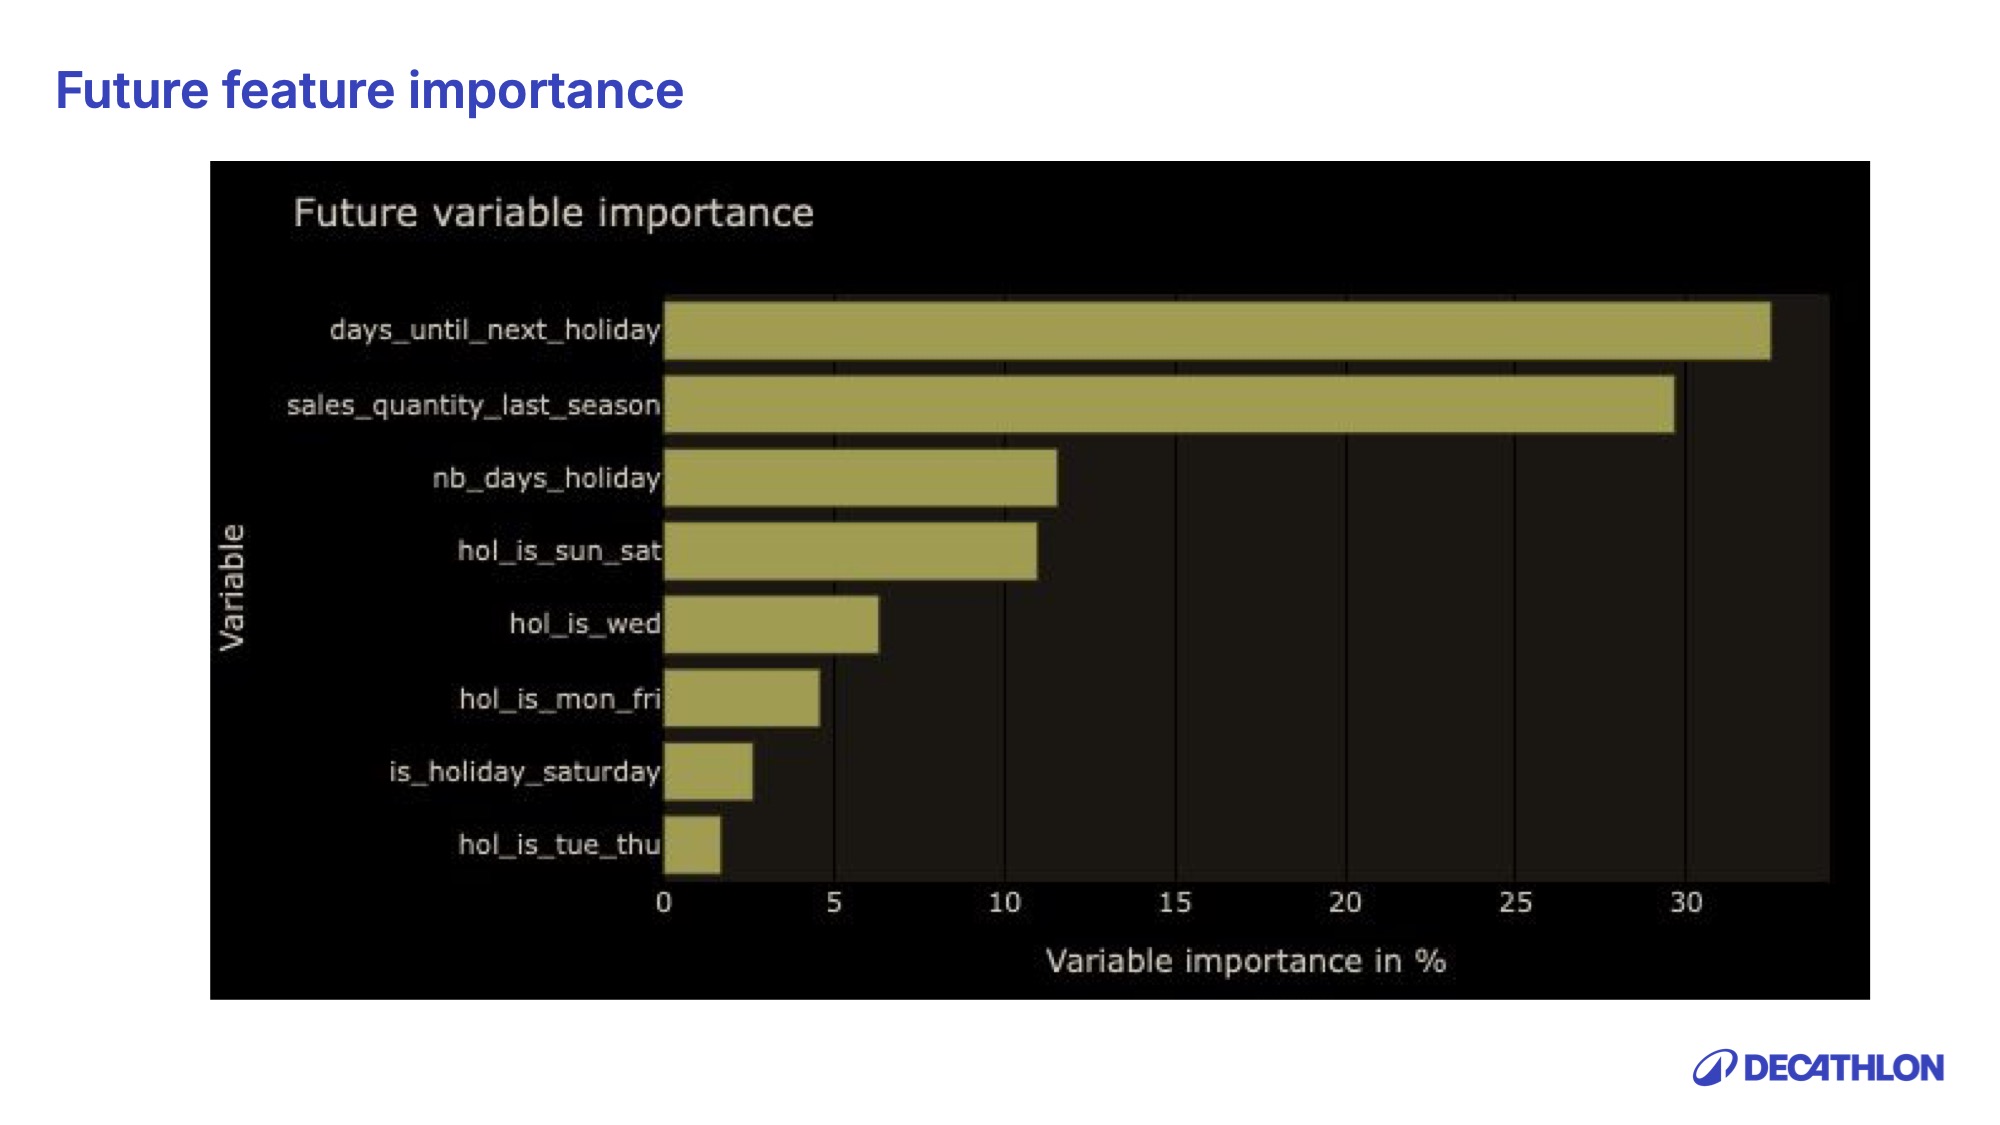
I inspected model feature importance to understand which inputs the TFT was using. The holiday countdown ranked highly alongside the previous season’s sales. That was a useful diagnostic, while the backtest remained the evidence for forecast quality; an importance score alone does not establish a causal effect.
I documented the work in Confluence, followed the team’s Jira workflow and presented the findings in English to an international team. Feedback directly shaped the next encoding experiments. What I took from the experience was a more disciplined way to build: state the question, check the data and implementation, run the comparison, and explain where the result holds.