Personal research · 2026
Crypto research
Months of models, wallet analysis and paper trading—and learning to question the experiment itself.
- My role
- Personal research & development
- Period
- 2026 · several months
- Data
- 15-minute candles · 22 tokens
- Trading
- Paper mode · Telegram monitoring
The question
I spent months exploring whether I could find a useful signal in crypto market data. I wanted to understand the problem for myself, so I built tools to study wallet behavior, trained models on price histories, explored Reddit text and ran paper-trading bots with Telegram monitoring.
Building the experiments
The work grew across several projects. Wallet analysis involved collecting transactions and reconstructing positions. A price-modeling pipeline used 15-minute candles across 22 tokens, with roughly 1.49 million recorded candle rows. More than 1,000 candidate features were narrowed to 300 for modeling.
Different experiments asked different questions. Predicting a future price direction and identifying current market conditions are separate tasks, even when their scores appear beside each other. I also studied whether collective buying and selling by large wallets contained a useful signal.
- Tokens studied
- 22
- Recorded candle rows
- ≈ 1.49M
- Selected features
- 300
- Direction-label horizon
- 4 h
The result that changed the story
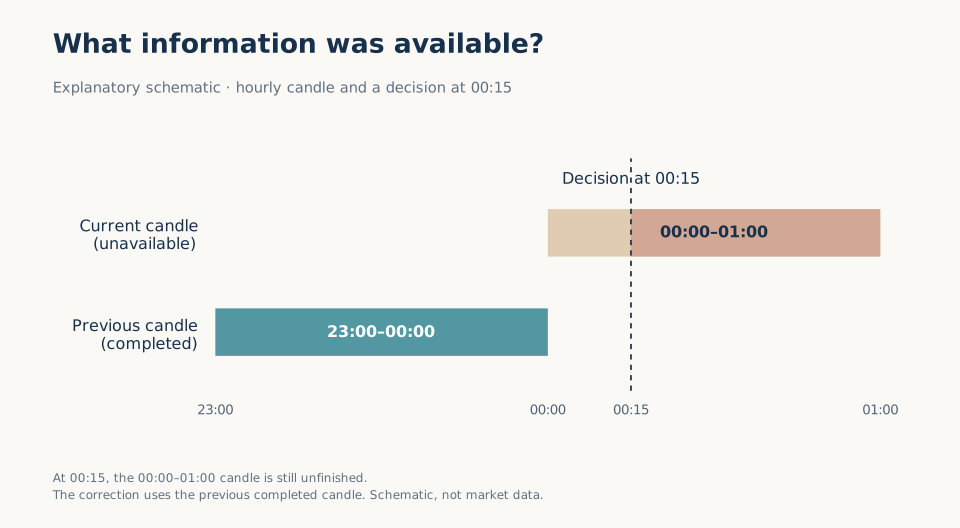
Some early results looked very strong. Comparing historical calculations with the information available during paper trading exposed future information in the features. Completed hourly bars were being used at timestamps before those bars had finished, and a decomposition method used later data when calculating earlier values.
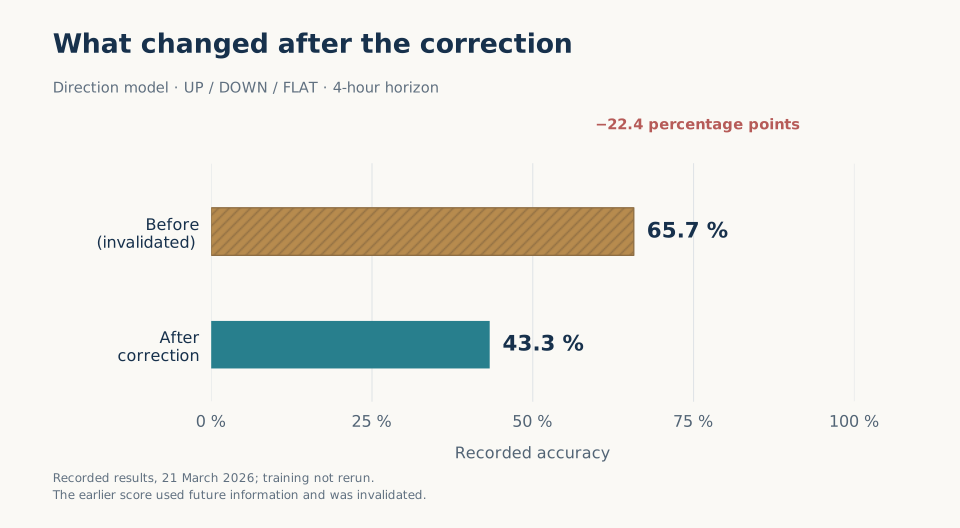
The correction used completed past bars and trailing windows. In the recorded rebuild, direction accuracy fell from 65.7% to 43.3%. That changed what I could conclude from the experiment.
- Before correction · invalidated
- 65.7%
- After correction
- 43.3%
- Accuracy difference
- −22.4 pp
Test other sources of signal
I also studied collective activity from large wallets. The saved whale-flow report examined 1,470 consensus-filter combinations; none survived its stated multiple-testing correction. That finding concerned the tested setup, rather than proving that all market signals are unusable.
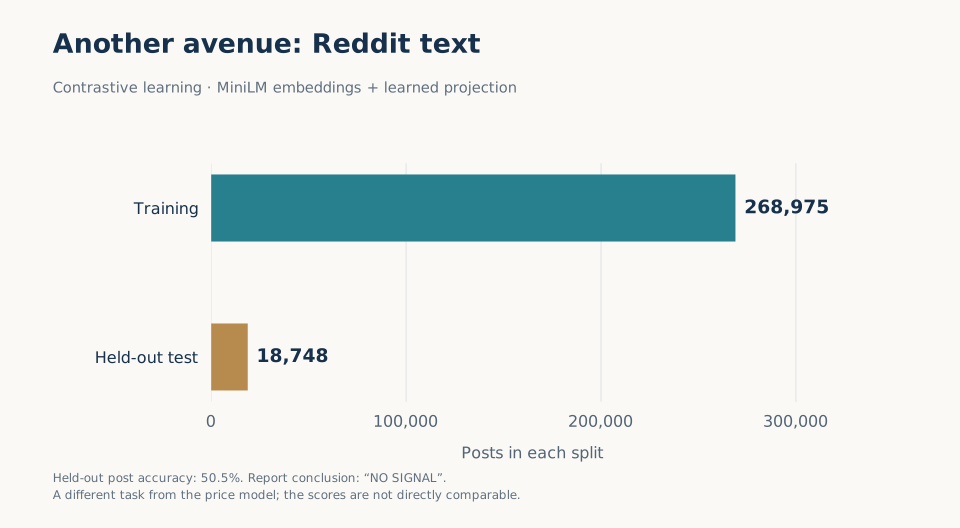
Another avenue used MiniLM embeddings of Reddit text and a learned projection. The contrastive-learning report recorded 268,975 training posts, 18,748 held-out test posts and 50.5% held-out post accuracy. Its conclusion was “NO SIGNAL”. This was a different task from the three-class price-direction model.
Follow whales with a paper-trading bot
I built a bot that watched selected large wallets and used their activity to trigger simulated positions, with Telegram monitoring. That turned the wallet research into an end-to-end experiment: detect a signal, open a paper position, follow it and record the exit.
The bot’s monitoring reported roughly +28 SOL in paper PnL. The later audit reconciled the final reset period, from 13 April to 18 May 2026, to +27.63 SOL-labelled units across 1,367 matched closed positions, starting from 11.81 units of simulated capital. The original monitoring filter showed +28.40; normalizing the timestamps included additional losses.
It was an encouraging milestone after months of research: the whale-following pipeline was running and producing a positive result in its own simulation. I then examined how much of that result depended on the simulator’s assumptions and a few exceptional recorded winners.
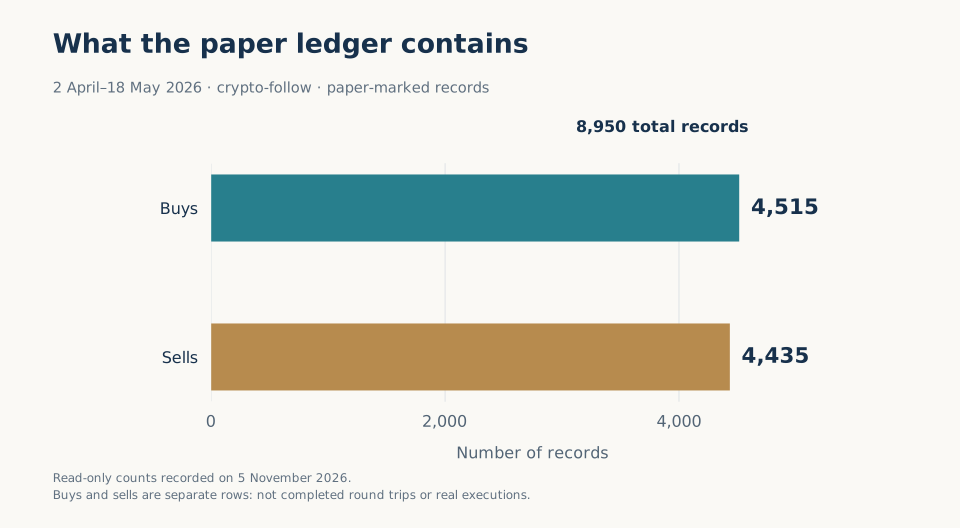
The broader crypto-follow ledger contains 4,515 buys and 4,435 sells from 2 April to 18 May 2026, all paper-marked. Those 8,950 rows count buys and sells separately and cover a longer period than the final-reset result above. The code connected them to Telegram alerts labelled [PAPER].
- SOL-labelled paper PnL
- ≈ +28
- Matched closed positions · final period
- 1,367
- Initial simulated capital · SOL units
- 11.81
Check what the simulator actually measures
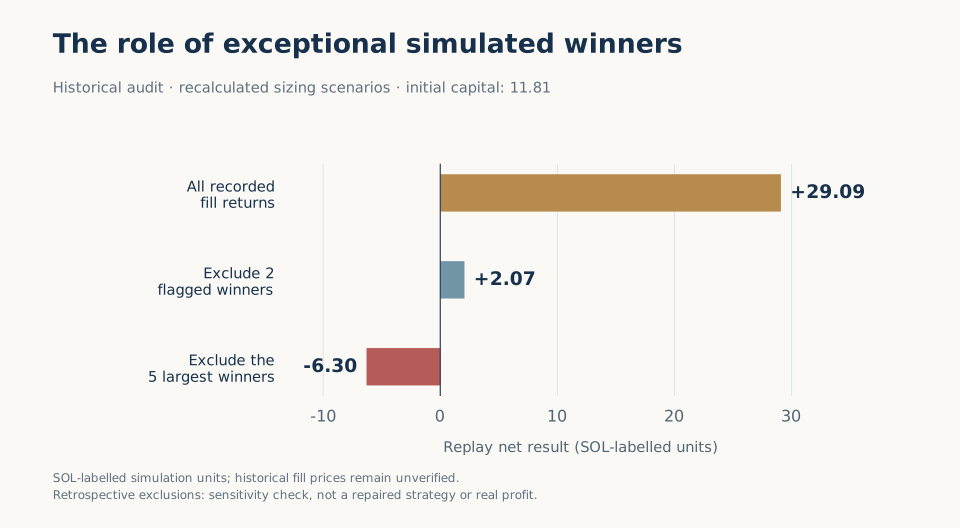
A later saved historical audit identified accounting, currency-conversion and simulated-fill limitations. Correcting cash calculations alone did not validate the strategy: exceptional recorded winners still dominated the results.
In a replay with recalculated position sizing, the saved result moves from +29.09 SOL-labelled units to +2.07 when two flagged winners are excluded, and to −6.30 without the five largest winners. These are retrospective exclusions using returns whose fill prices remain unverified. They test sensitivity, rather than establishing real profit or a repaired strategy.
I later adapted an existing automated-research framework to organize continued experiments around a fixed dataset, baselines and clearer comparison rules. The work became as much about the reliability of the experiment as the choice of model.
The adapted harness log contains 384 entries spanning baselines, trials, crashes and restored candidates. That is not a count of 384 independent successful experiments. Comparisons need to stay within the same target definition.
What stayed with me
This is one of the projects that feels most like me. I followed a question long enough to understand why some promising answers did not hold up. It gave me experience in data engineering, modeling and operational debugging, and made me more careful about what a result actually demonstrates.
The figures above come from saved experiment records. They describe those experiments, not current predictive performance or a profitable trading strategy.